erning
Blog

The Smart Money Concept (SMC) is a method that teaches you about market structure, supply and demand, and support and resistance. Market makers, including banks and hedge funds, often leave traces of their trading activities on charts, and SMC traders aim to follow these indicators.
While retail traders may believe the market operates fairly in their favor, the SMC suggests otherwise. Market makers have the power to influence prices against retail traders, which, it may sound conspiratorial, warrants investigation. These institutions are primarily focused on generating profits or fulfilling the needs of large corporations or governments.
They utilize their extensive resources and market insights to create conditions that may trick retail traders into losing money. Although many retail traders remain unaware of these manipulative practices and are vulnerable to market fluctuations, the SMC recognizes that not all actions by large players are malicious.
For example, a government needing to buy substantial amounts of a commodity can naturally sway prices in one direction. In summary, the SMC theory posits that financial markets are predominantly influenced by major financial institutions, hedge funds, and governments, which significantly affect price movements. Retail traders should stay vigilant to understand these players' intentions and better predict market trends.
Here’s an overview of key SMC concepts:
-
Premium and Discount
-
Multi Timeframe Analysis
Supply and Demand Zone
-
SD structural zone
-
SD Flip Zone
Liquidity
-
Examples
Risk Management
-
Trade Entries
-
Trade Management
Putting it All Together
-
HTF analysis and Low Time Frame Entries


-
Market structure involves identifying the current market trends. The market trend indicates the direction the market is moving over a specific timeframe. By analyzing this overall direction, analysts, retail investors, and organizations can anticipate possible market changes. This insight allows them to effectively allocate their funds for buying, selling, or investing to achieve profits.
-
Market Trend is most important to trade or invest in the financial market. Understanding market trends is crucial for beginners. Failing to identify the right trend can lead to losses. Therefore, beginners must learn how to recognize trend in the real market.
-
A helpful tool for this purpose is the "Fractals, By Rachel_T" indicator on Trading View. Once you add this tool, navigate to the settings -input section, select these two options listed below, and uncheck any others that may be selected, then begin practicing.
Chapter 1: Market Structure


Types
Uptrend - Bullish market Structure
Downtrend - Bearish Market Structure
Consolidation - Sideways Market
Bullish Market Structure -Uptrend
-
An uptrend, or bullish market structure, is characterized by a sequence of Higher Highs and Higher Lows.
-
To qualify as an uptrend, at least one Higher High and one Higher Low must be established.
-
Market structures or trends do not always exhibit a straight line of movement; real markets experience minor fluctuations that can disrupt major structures.
BoS/MSB/BMS/SB
-
The terms Break of Structure (BoS), Market Structure Break (MSB/BMS), and Structure Break (SB) all to the same concept.
-
The break of structure emphasizes recognizing shifts in the overall market trend, which occurs when the price creates a new high or low while surpassing previous ones.
-
To identify a BoS, a candle must close above the recent swing high with its body; a wick that surpasses the swing high does not count.


In this example, the real-time market demonstrates greater fluctuations can alter the structure. We must wait for a clear break in the structure before executing any trades. Patience is crucial throughout this process.

-
A Downtrend, or bearish market structure, is characterized by a sequence of Lower Highs and Lower Lows.
-
To qualify as a downtrend, at least one Lower High and one Lower Low must be established.
-
The market aims to reverse its direction by establishing a Bearish Break Structure (BoS) and identifying its valid Lower Low.
-
To confirm a bearish market structure or the persistence of a bearish trend, the market must first create a valid Lower High and Lower Low (LL).


CHoCH (Change of Character) - An Overview of CHoCH and Its Usage:

-
CHoCH, which stands for "change of character," indicates a shift in market sentiment or behavior within trading. This change can occur when the market transitions from a bullish to a bearish trend, or vice versa, often resulting from a shift in the market's movement patterns.
-
Traders utilize order block trading to pinpoint and capitalize on these character changes. Additionally, CHoCH is recognized as a reversal when the price does not create a new higher high or lower low, breaking the established pattern and starting to move in a different direction.
-
ChoCh mostly comes in the discount price for uptrnd and premium price for downtrend
-
ChoCh is always a risky trade, if buying or selling pressure is more, most of the times the market will be reversed from the ChoCh zones. if ChoCh zone comes in discount for uptrend then its high probability entry and downtrend vise versa
How to identify a Change of Character (ChoCh)?

- The market continues to break upward in a pattern of higher highs (HH) and higher lows (HL).
- When the market establishes the final higher high and then quickly reverses, dropping below the last higher low prior to that high, a bearish Change of Character (ChoCh) is indicated.
- While ChoCh can provide early insights, it's wise to use the Fibonacci tool to evaluate premium and discount levels, along with other technical confirmations like higher time frame supply and demand zones or order blocks before making a trade.
Note: Not every ChoCh will result in a successful trend reversal. The market can be unpredictable, and at times, price movements may only represent temporary fluctuations.
LIQUIDITY
-
The most significant factor in this market is liquidity. Liquidity is preferred because this market is driven by price manipulation, and to be present means to engage in price manipulation. Let’s go on to the most crucial phase, which is how do we know where the liquidity is in the chart, after understanding why liquidity is vital. You must first have some knowledge, though. We lack the Center Bank’s data, so we are unable to determine the location of the Liquidity.
-
There are prospective locations with very high liquidity and probability locations with low liquidity, therefore we can only predict where liquidity can be discovered. You must understand that liquidity determines every market top and bottom.
-
The larger the time frame, the greater the liquidity, and therefore the liquidity is more; however, the more we go down to smaller time frames, the weaker the liquidity will be, so in order to know whether or not this is important liquidity, we must understand that HIGHER TIME FRAMELIQUIDITY is not the same as LOWER TIME FRAME LIQUIDITY.
Types of Liquidity: Liquidity influences all structural movements in the market.
-
Double Top and Bottom or Equal Low and High
-
Support and Resistance
-
Trendline Liquidity
1. Double Tops and Bottoms or Equal High's and Low's in Forex:
Double tops and bottoms or (EQL and EQH) represent areas where liquidity exists, with prices frequently wicking into these zones to seize it before reversing direction. Major market participants analyze multiple timeframes to identify these liquidity zones, enabling them to make significant market moves.


In the example below, the market sweeps the initial high to collect liquidity and then candle closes below that high price. After the candle closes under this level, an entry can be considered.
To validate a double top, two highs should be near the same level, either equal or sweeping the first followed by a candle closing beneath it.
Note: if the price strongly rejects from the first high, the chance of a double top forming increases.
How to Use Double Top in Forex


The difficulty with this pattern in forex is that it often attracts liquidity above the highs where orders are placed. Consider the traders who shorted from the previous high; they likely set their stop losses at or just above that level. As a result, if institutions intend to build a short position, they are likely to target those stop-loss orders above the highs.
Additionally, there are probably stop-limit buy orders positioned above the high, as breakout traders aim to take advantage of a potential bullish breakout
Understanding the issue of using the Double Top pattern in Forex.
Double Top and Equal High's
Double Bottom and Equal Low's
The Double Top pattern resembles an "M" formation, with two highs being close to or equal to each other. It indicates a bearish reversal., the price will take out the liquidity of the first high before declining. Once the neckline is breached and a candle closes below it, the price tends to retrace to the 0.5 or .3 Fibonacci level before continuing downward.
LIQUIDITY - SUPPORT AND RESISTANCE/Buy and Sell Side Liquidity (BSL & SSL)
Support and resistance levels indicate buying and selling take place, creating liquidity above resistance and below support. Prices are often manipulated to capture this liquidity. it's often-called buy side liquidity (BSL) and sell side liquidity (SSL).
Bullish example at Key Support Level
The "EURUAD chart shows a bullish trend following a support bounce. In thsi example,When a key support level is broken, it triggers sell stop orders (SSL). After these orders are executed, prices may rise rapidly, offering opportunity for buy trades..
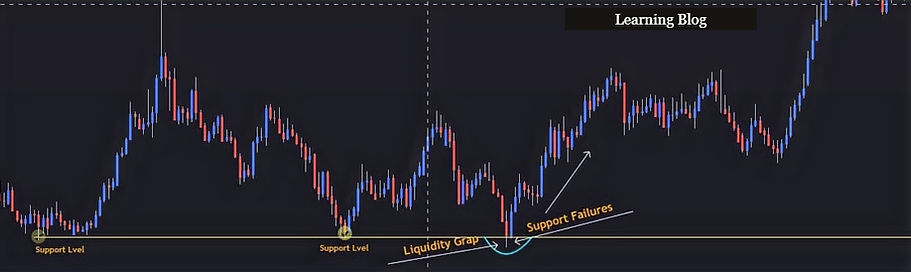
EURAUD Daily chart - initiating a buy trade after capturing liquidity at the support.
When executing a bullish trade using SUPPORT level:
-
Spotting liquidity close to a support level.-
-
Anticipating break of the support level that activates sell orders.
-
for a rebound accompanied by reversal signals.
-
Requiring confirmation or a change of character (CHOCH) on the lower time frame, preferably at least 15 minutes.
-
seeking a bullish engulfing candle for further confirmation.
-
Looking for a Value Gap (FVG) that is larger size.
-
Entering a buy trade after confirming the 15minute reversal.
Resistance Level HH trading opportunities:
When a key Resistancelevel is broken, it triggers buy stop orders (BSL). After these orders are executed, prices may fallrapidly, offering opportunity for sell trades.
Trendline Liquidity:
Trendline liquidity occurs when traders engage in buying and selling at trendlines, generating liquidity. Major market participants often influence prices at these trendlines to capture this liquidity. This area primarily influences breakout traders.


In the example below, the price touches the trendline for multiple times, generating sufficient liquidity to grab. Ultimately, it takes the liquidity and moves downward. Here, breakout traders were influenced; when they attempted to enter a buy position after the trendline break, the market hit their stop loss and moved in its own direction.It responded to the supply zone on a higher timeframe. Before trading with these trendlines, it's crucial to examine multiple timeframes to identify any valid supply zones or unmitigated order blocks. If they are present, consider placing entries in that supply zone; otherwise, refrain from trading. Wait for a structure break before entering to avoid unnecessary stop losses.

-Swing High's and Low's
